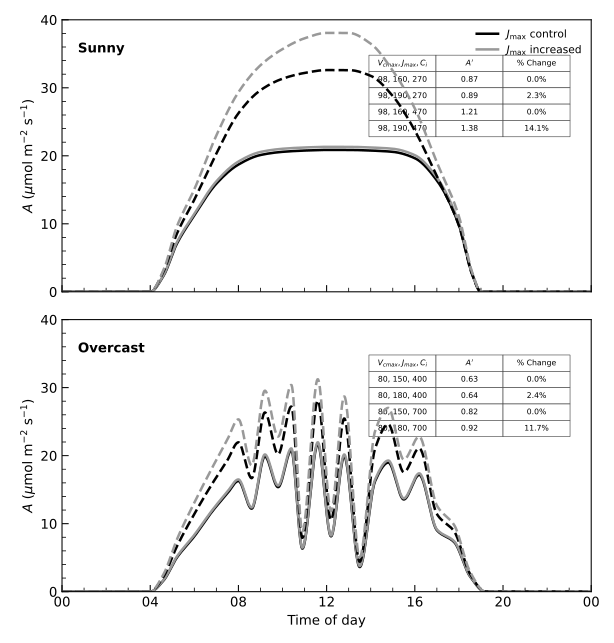
The Bernacchi 2013 model is a review-and-synthesis presentation of the Farquhar, von Caemmerer & Berry (FvCB) biochemical model of C₃ photosynthesis, tracing how the same steady-state framework is used from the chloroplast all the way up to the ecosystem scale. Net CO₂ assimilation is expressed as the minimum of three potential rates: Rubisco-carboxylation-limited (), RuBP-regeneration (electron-transport)-limited (), and triose-phosphate-utilization-limited (), each written as a function of intercellular CO₂ (), photosynthetically active photon flux density (PPFD), and the enzyme capacities , and TPU. The GreenSloth implementation follows this classical formulation directly: the light-limited electron transport rate is obtained from a non-rectangular hyperbola of absorbed light and , and is the minimum of the three limiting rates minus day respiration .
Beyond restating the biochemistry, the paper's contribution is showing how the model's parameters (, , , , ) can be scaled with temperature and how the resulting leaf-level – curves feed into canopy and land-surface models used for ecosystem- and global-scale predictions of carbon uptake. In GreenSloth it serves as a standard, well-parameterized FvCB-type reference model alongside FvCB 1980 and Johnson 2021, against which extensions of the classical Rubisco-limited/RuBP-regeneration-limited switching can be compared.
Model definition
Parameters
| Symbol | ID | Value | Unit |
|---|---|---|---|
| Ci | 275 | ||
| PPFD | 1500 | ||
| Vcmax | 100 | ||
| Jmax | 200 | ||
| TPU | 12 | ||
| Rd | 1.5 | ||
| Gamma_star | 42.75 | ||
| Kc | 404.9 | ||
| Ko | 278.4 | ||
| O | 210 | ||
| alpha | 0.24 | ||
| theta | 0.7 |
Derived quantities
| Symbol | ID | Equation | Unit |
|---|---|---|---|
| absorbed | |||
| Ci_safe | |||
| J | |||
| Wc | |||
| rubisco | |||
| rubp | |||
| tpu | |||
| an |
Curation
- July 2026: Maintenance by Marvin van Aalst
- July 2025: Initial implementation by Tanvir Hassan
This model was validated by reproducing the following figures of the original publication. Due to copyright restrictions, a side-by-side comparison of the original figures is not shown here.
Figures
Fig2
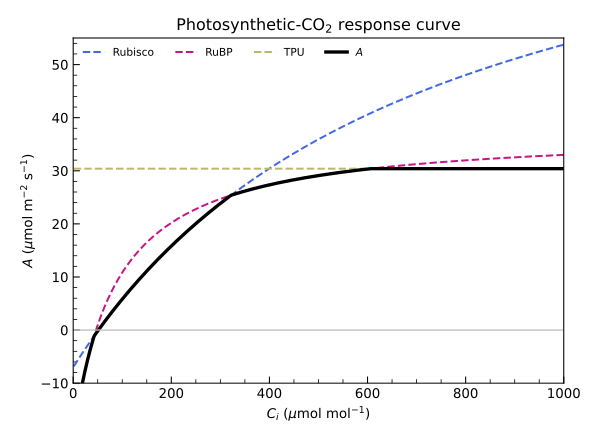
Fig3
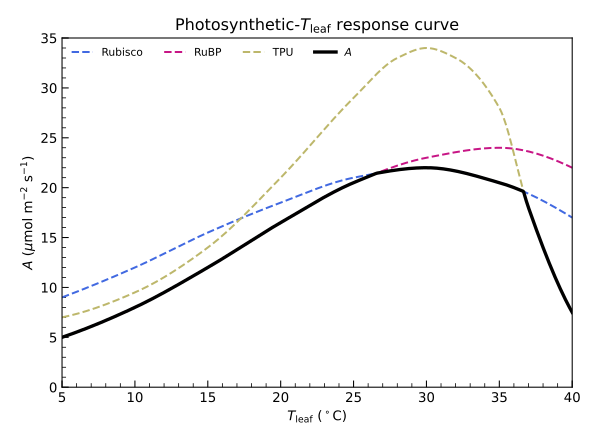
Fig4
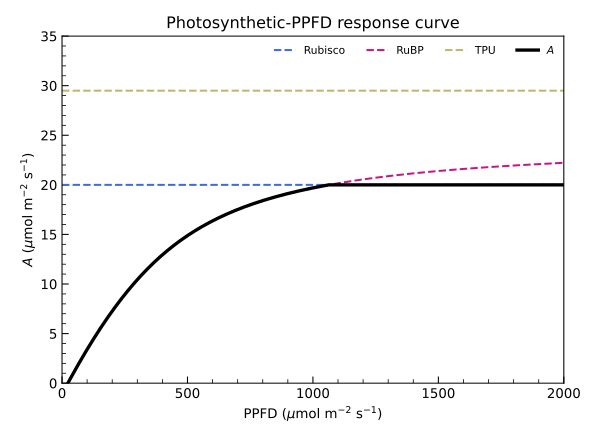
Fig5
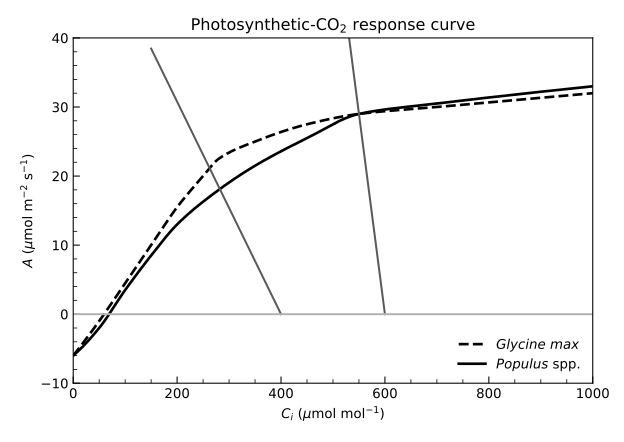
Fig6
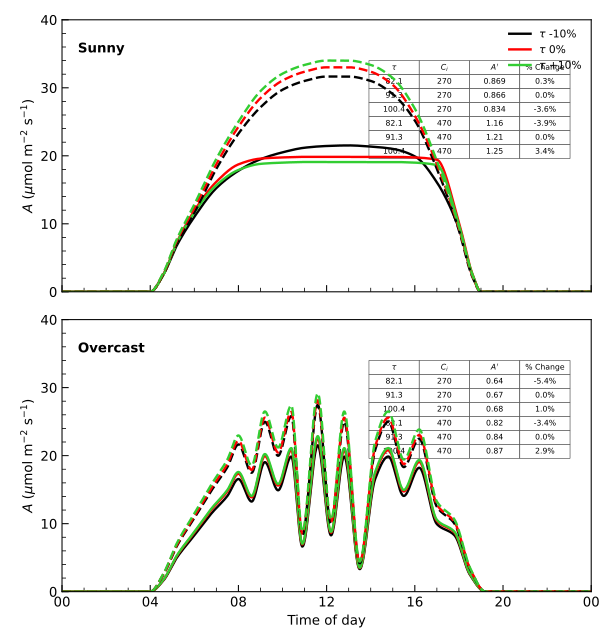
Fig7